
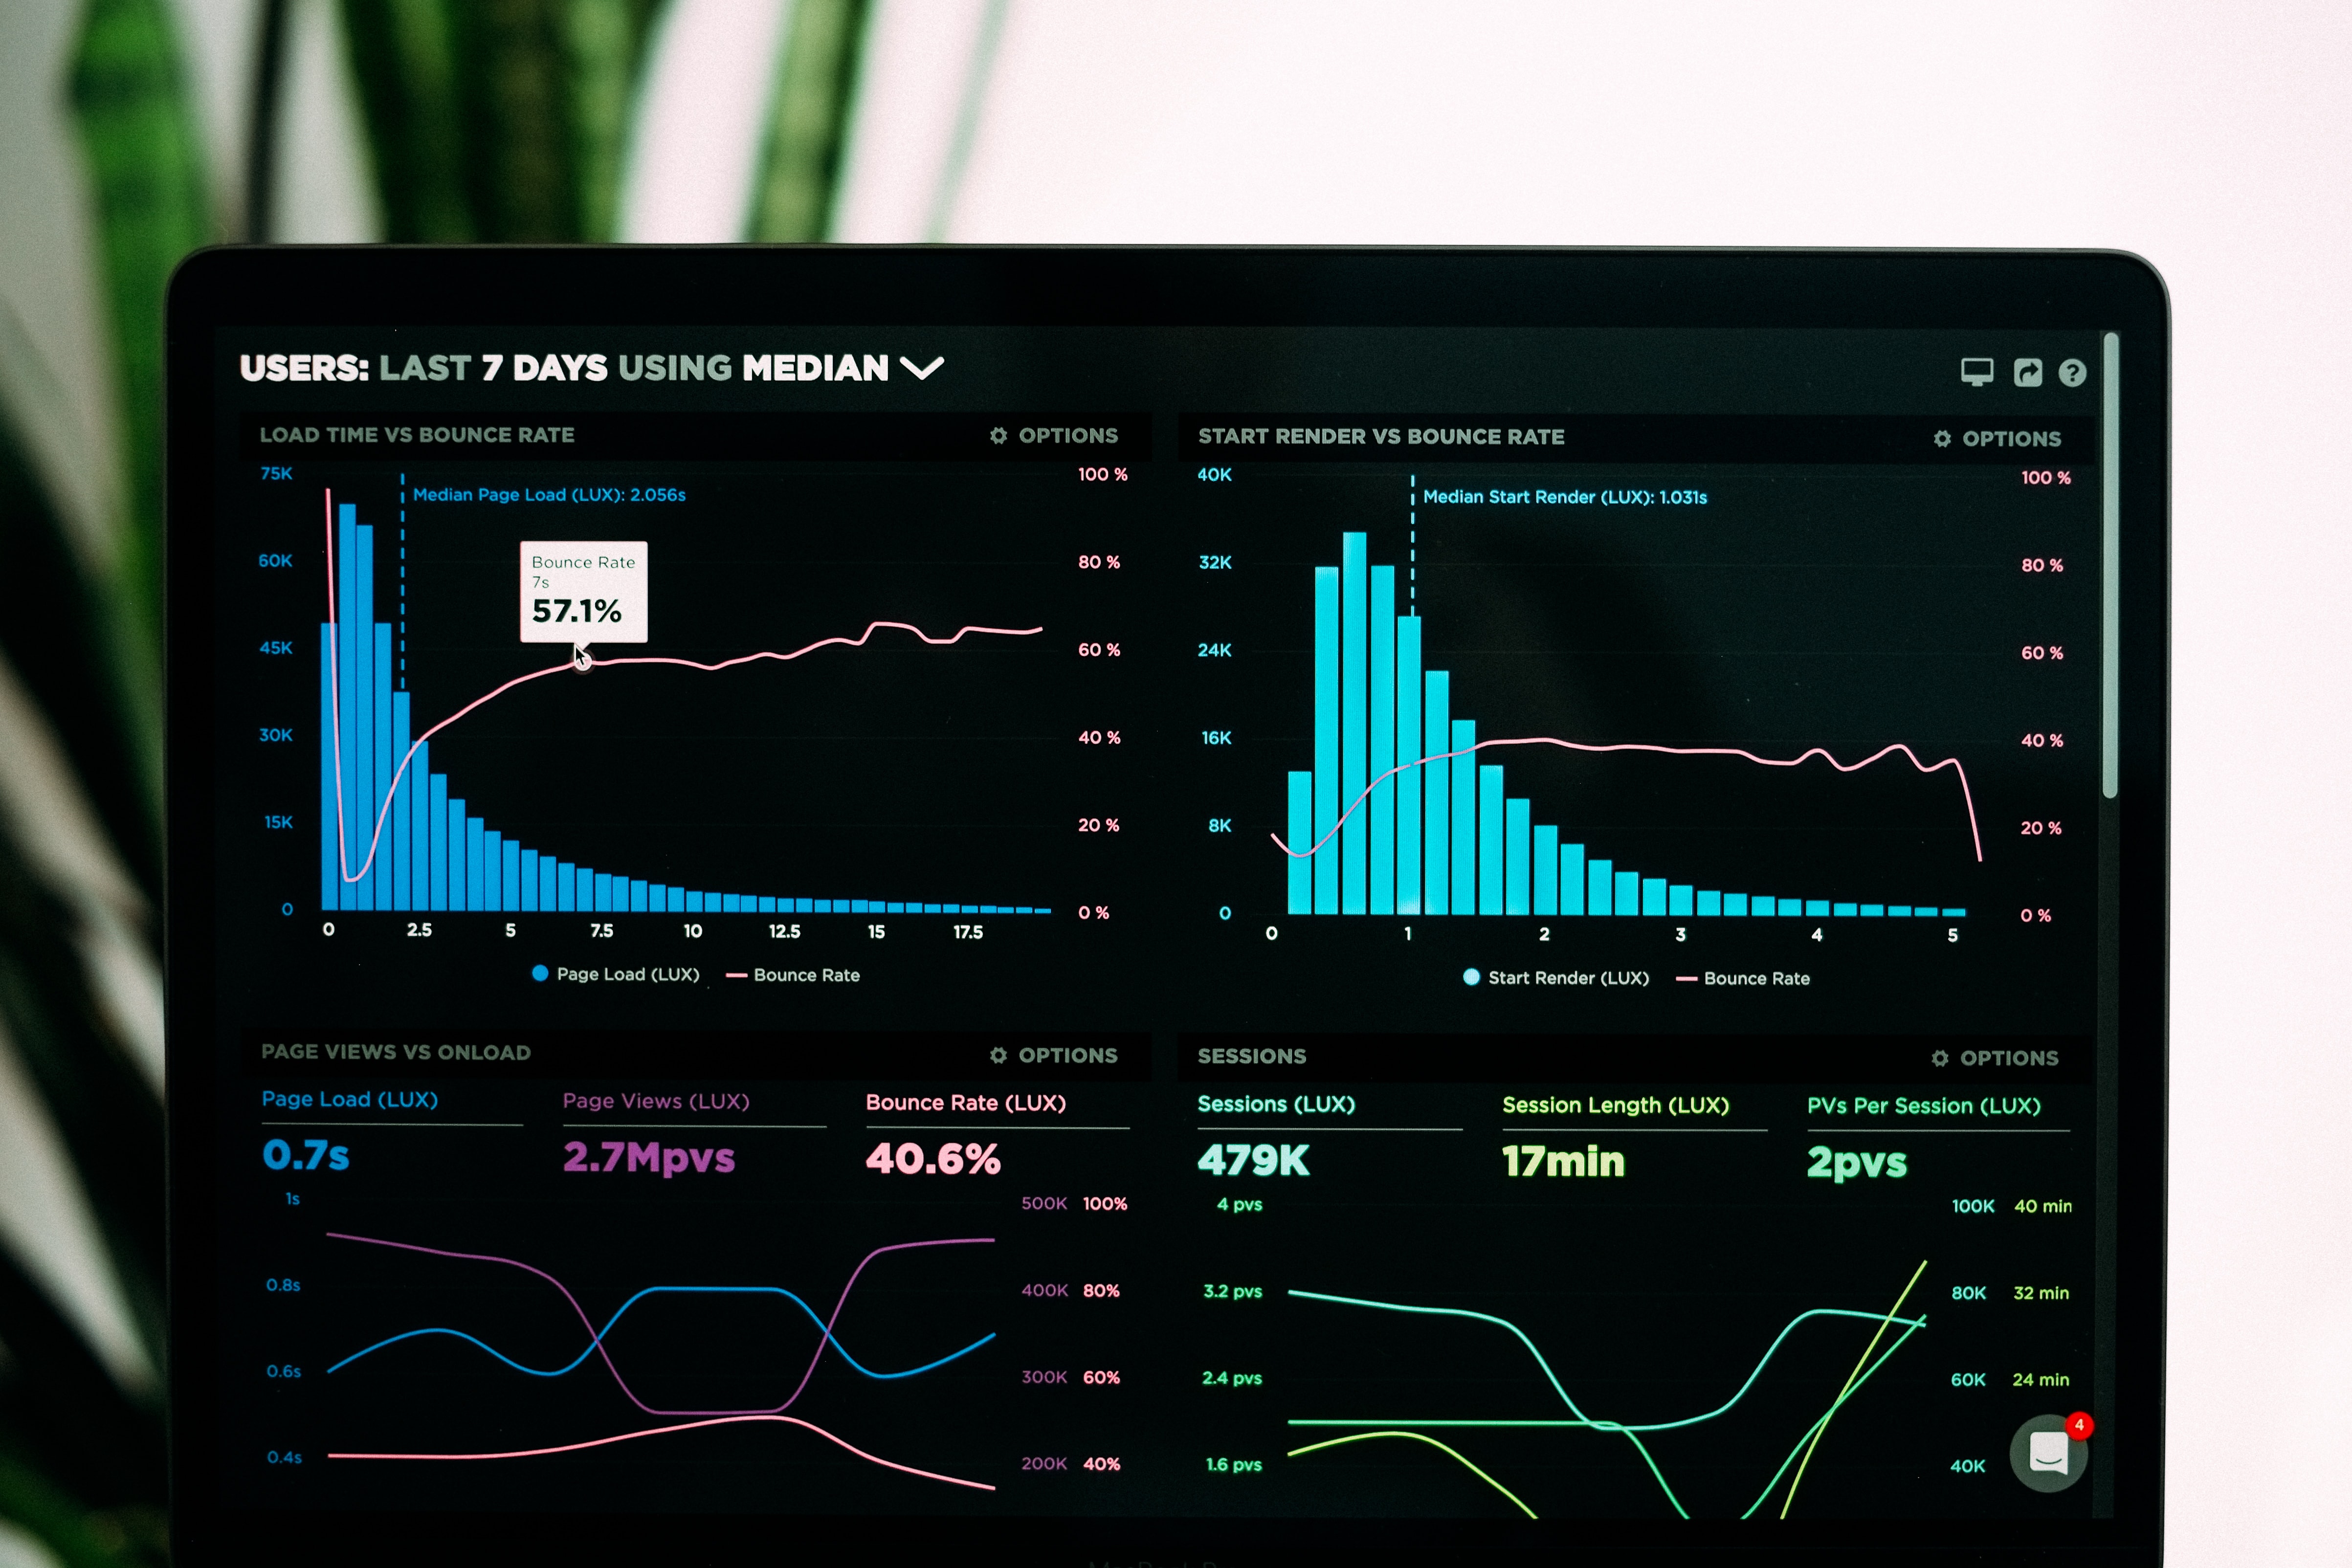
Bank Strategy Client Segmentation
Development of a customer segmentation model for a banking credit card portfolio using K-Means clustering, aimed at increasing profitability through targeted CRM strategies. The project grouped 8,950 clients into 8 behavioral clusters based on spending patterns, credit usage, cash advance behavior, and payment profile. As a result, the segmentation enables actionable strategies for revenue growth (upsell/cross-sell), cost reduction (more efficient campaigns), and risk mitigation (loss prevention). The expected annual ROI ranges from ~$30K (conservative) to ~$250K+ (optimistic), with a moderate expected impact around ~$100K/year, subject to A/B testing validation.
Tools used:
- Python, Pandas, NumPy, and Scikit-learn.
- Jupyter Notebooks.
- Machine Learning with K-Means Clustering.
- PCA for visualization and cluster interpretability.
- Cluster evaluation metrics (Silhouette Score, Davies-Bouldin, Calinski-Harabasz).

Rossmann Sales Prediction
Development of a sales forecasting model for the Rossmann pharmaceutical retail chain using time series regression algorithms, aimed at cost reduction. The model reduced the average forecasting error from 36% to 4.65% (-31%) for the next six weeks, representing approximately €19 million in additional monthly revenue, using Kaggle data.
Tools used:
- Python, Pandas, NumPy, Seaborn, Scikit-learn, SciPy, and Boruta.
- Anaconda and Jupyter Notebooks.
- Machine Learning with XGBoost Regressor.
- Render Cloud.
- Flask API.
- Telegram Bot API.
Real Estate Acquisition and Resale Strategy to Maximize Profit
Identification of properties priced below market average and definition of optimal resale prices through exploratory data analysis in Python.
Tools used:
- Python, Pandas, NumPy, and Seaborn.
- Anaconda and Jupyter Notebooks.
- Interactive maps with Plotly and Folium.
- Render Cloud.
- Streamlit framework.
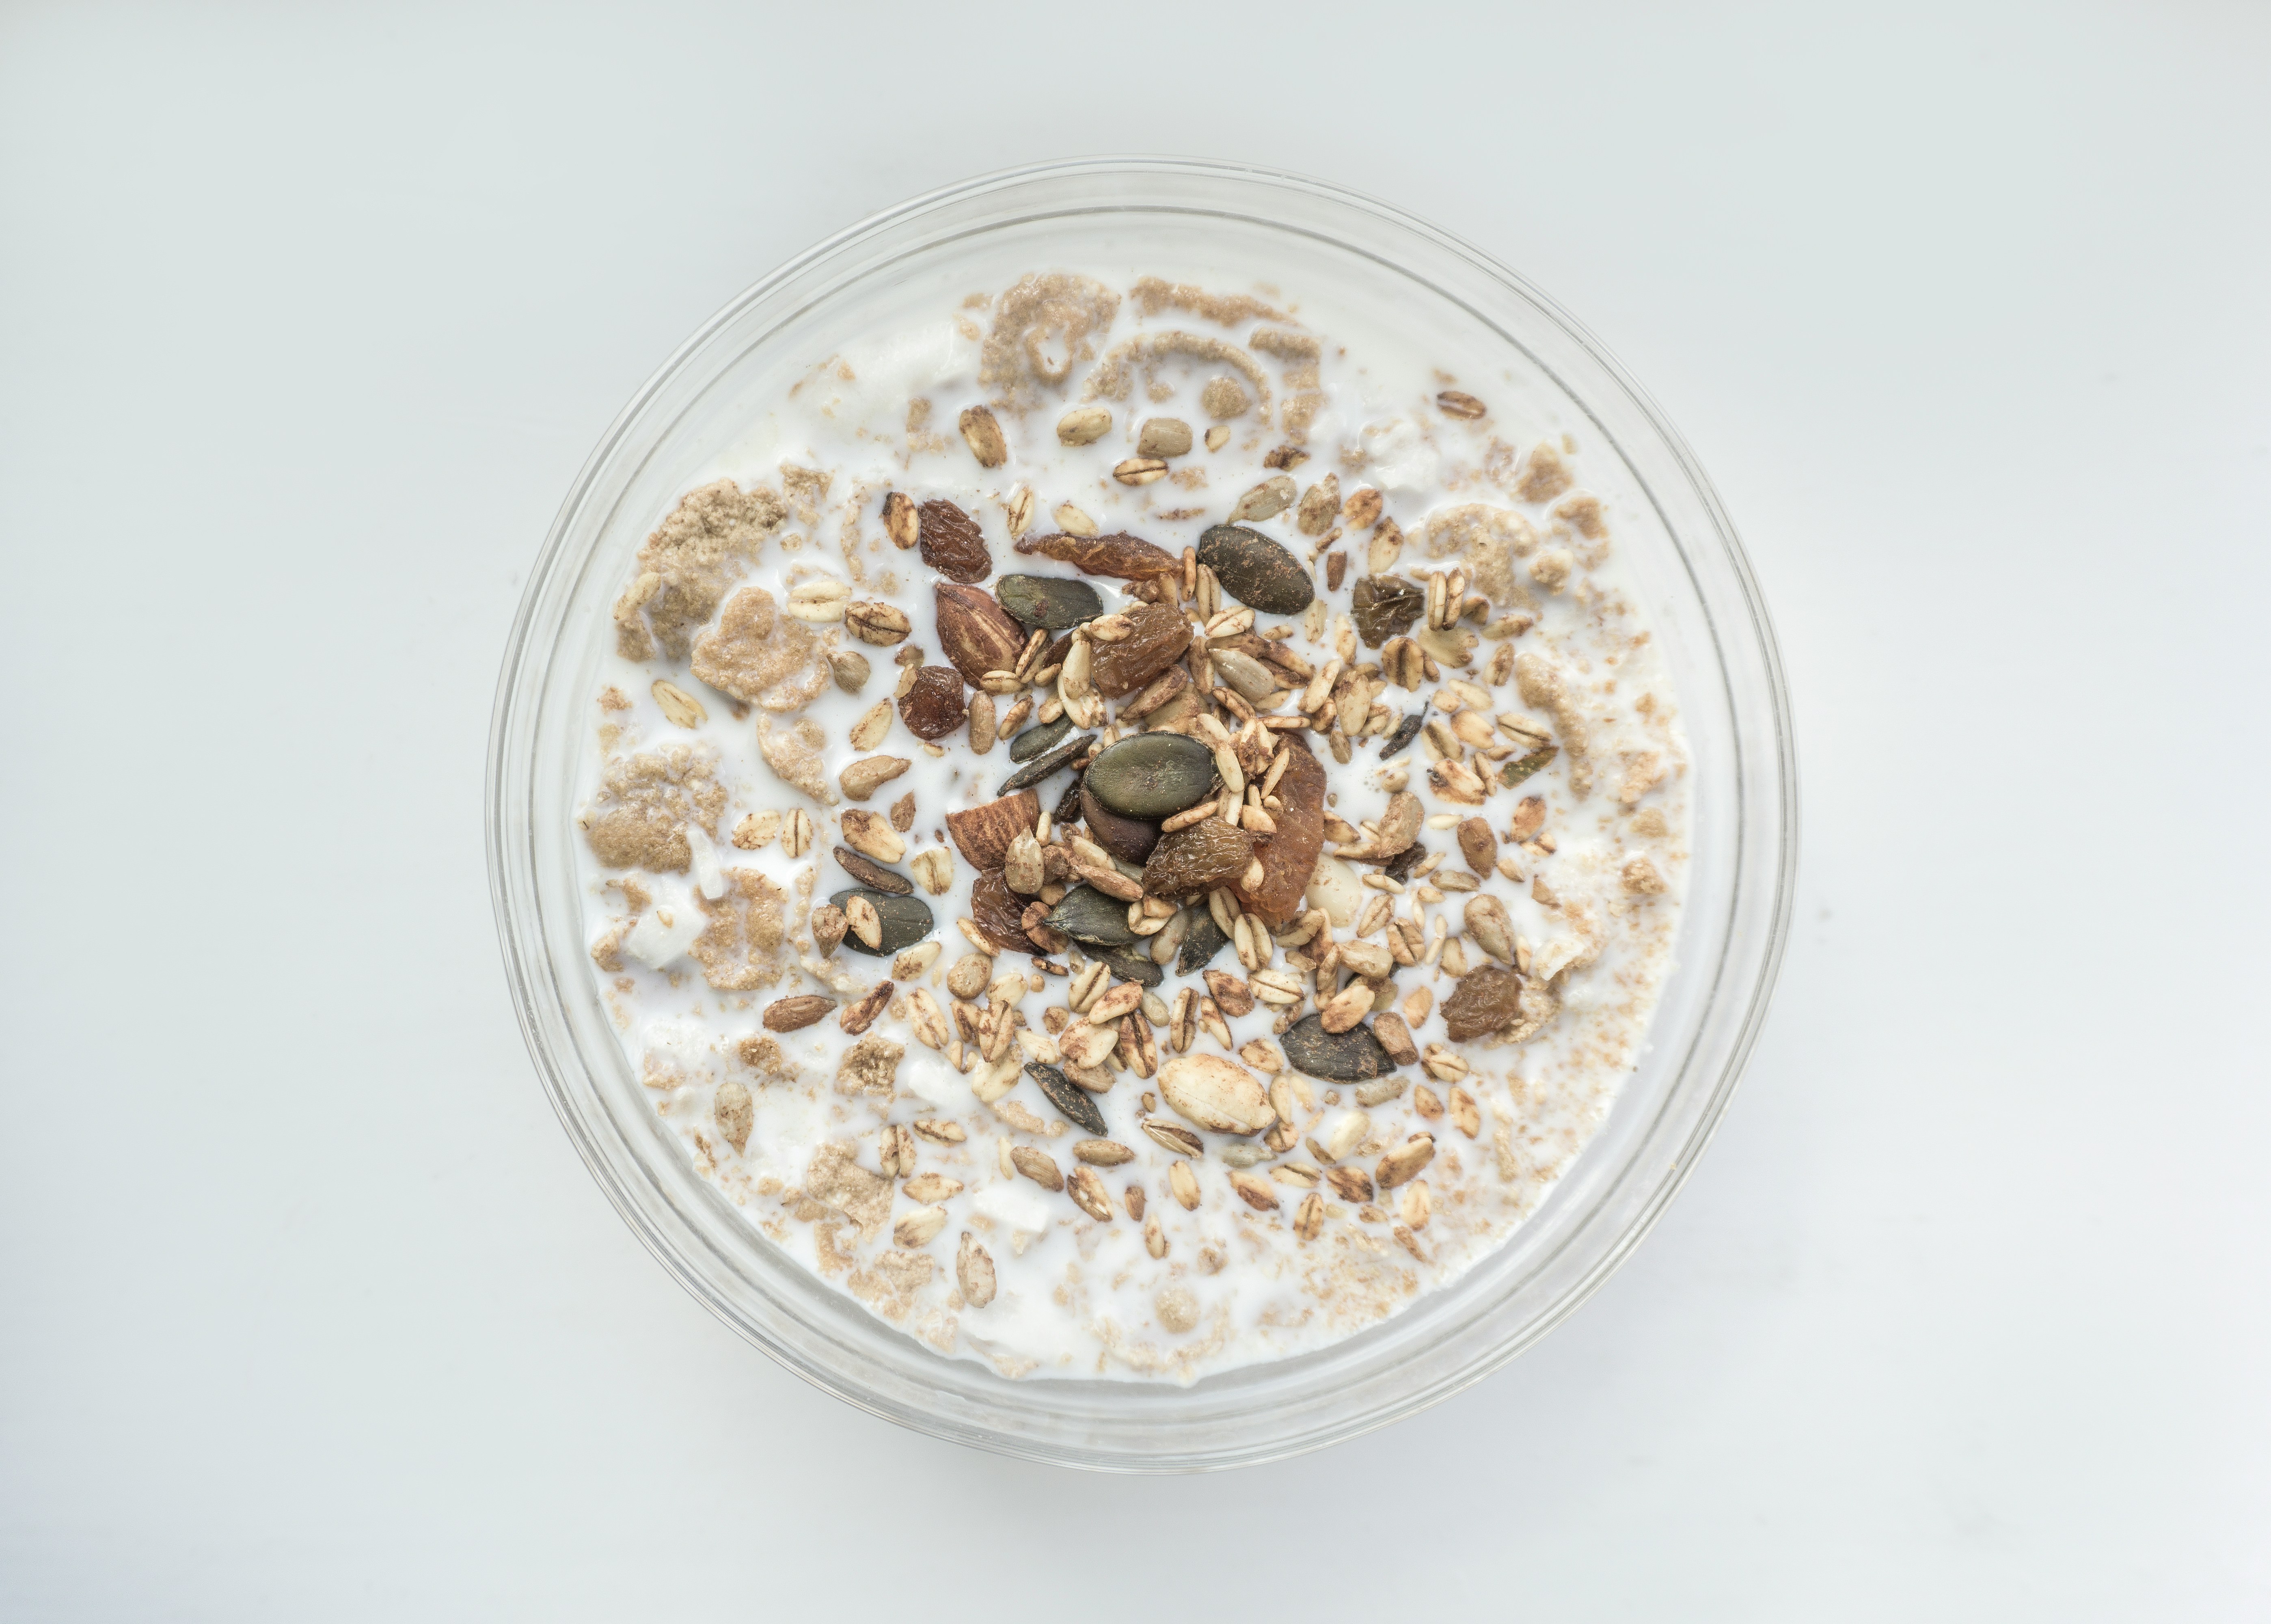
Nutritional Analysis of Cereals with Interactive Dashboard in R
Development of an interactive web application for exploratory analysis of nutritional
data from various cereal brands. The dashboard enables comparison of key nutritional
metrics such as calories, sugars, sodium, and protein across manufacturers.
Tools used:
- R, Shiny, ggplot2, dplyr, and tidyverse.
- Interactive dashboards with Shiny.
- Exploratory Data Analysis (EDA).

Student Analytics Performance Interactive Dashboard in R
Analytical dashboard focused on inferential statistics.
The application performs hypothesis tests (ANOVA and T-test) and real-time correlation analyses
to determine the statistical significance of factors such as sleep, frequency, and study hours on students' final performance.
Tools used:
- R, Shiny, ggplot2, dplyr, and tidyverse.
- Interactive dashboards with Shiny.
- Exploratory Data Analysis (EDA)
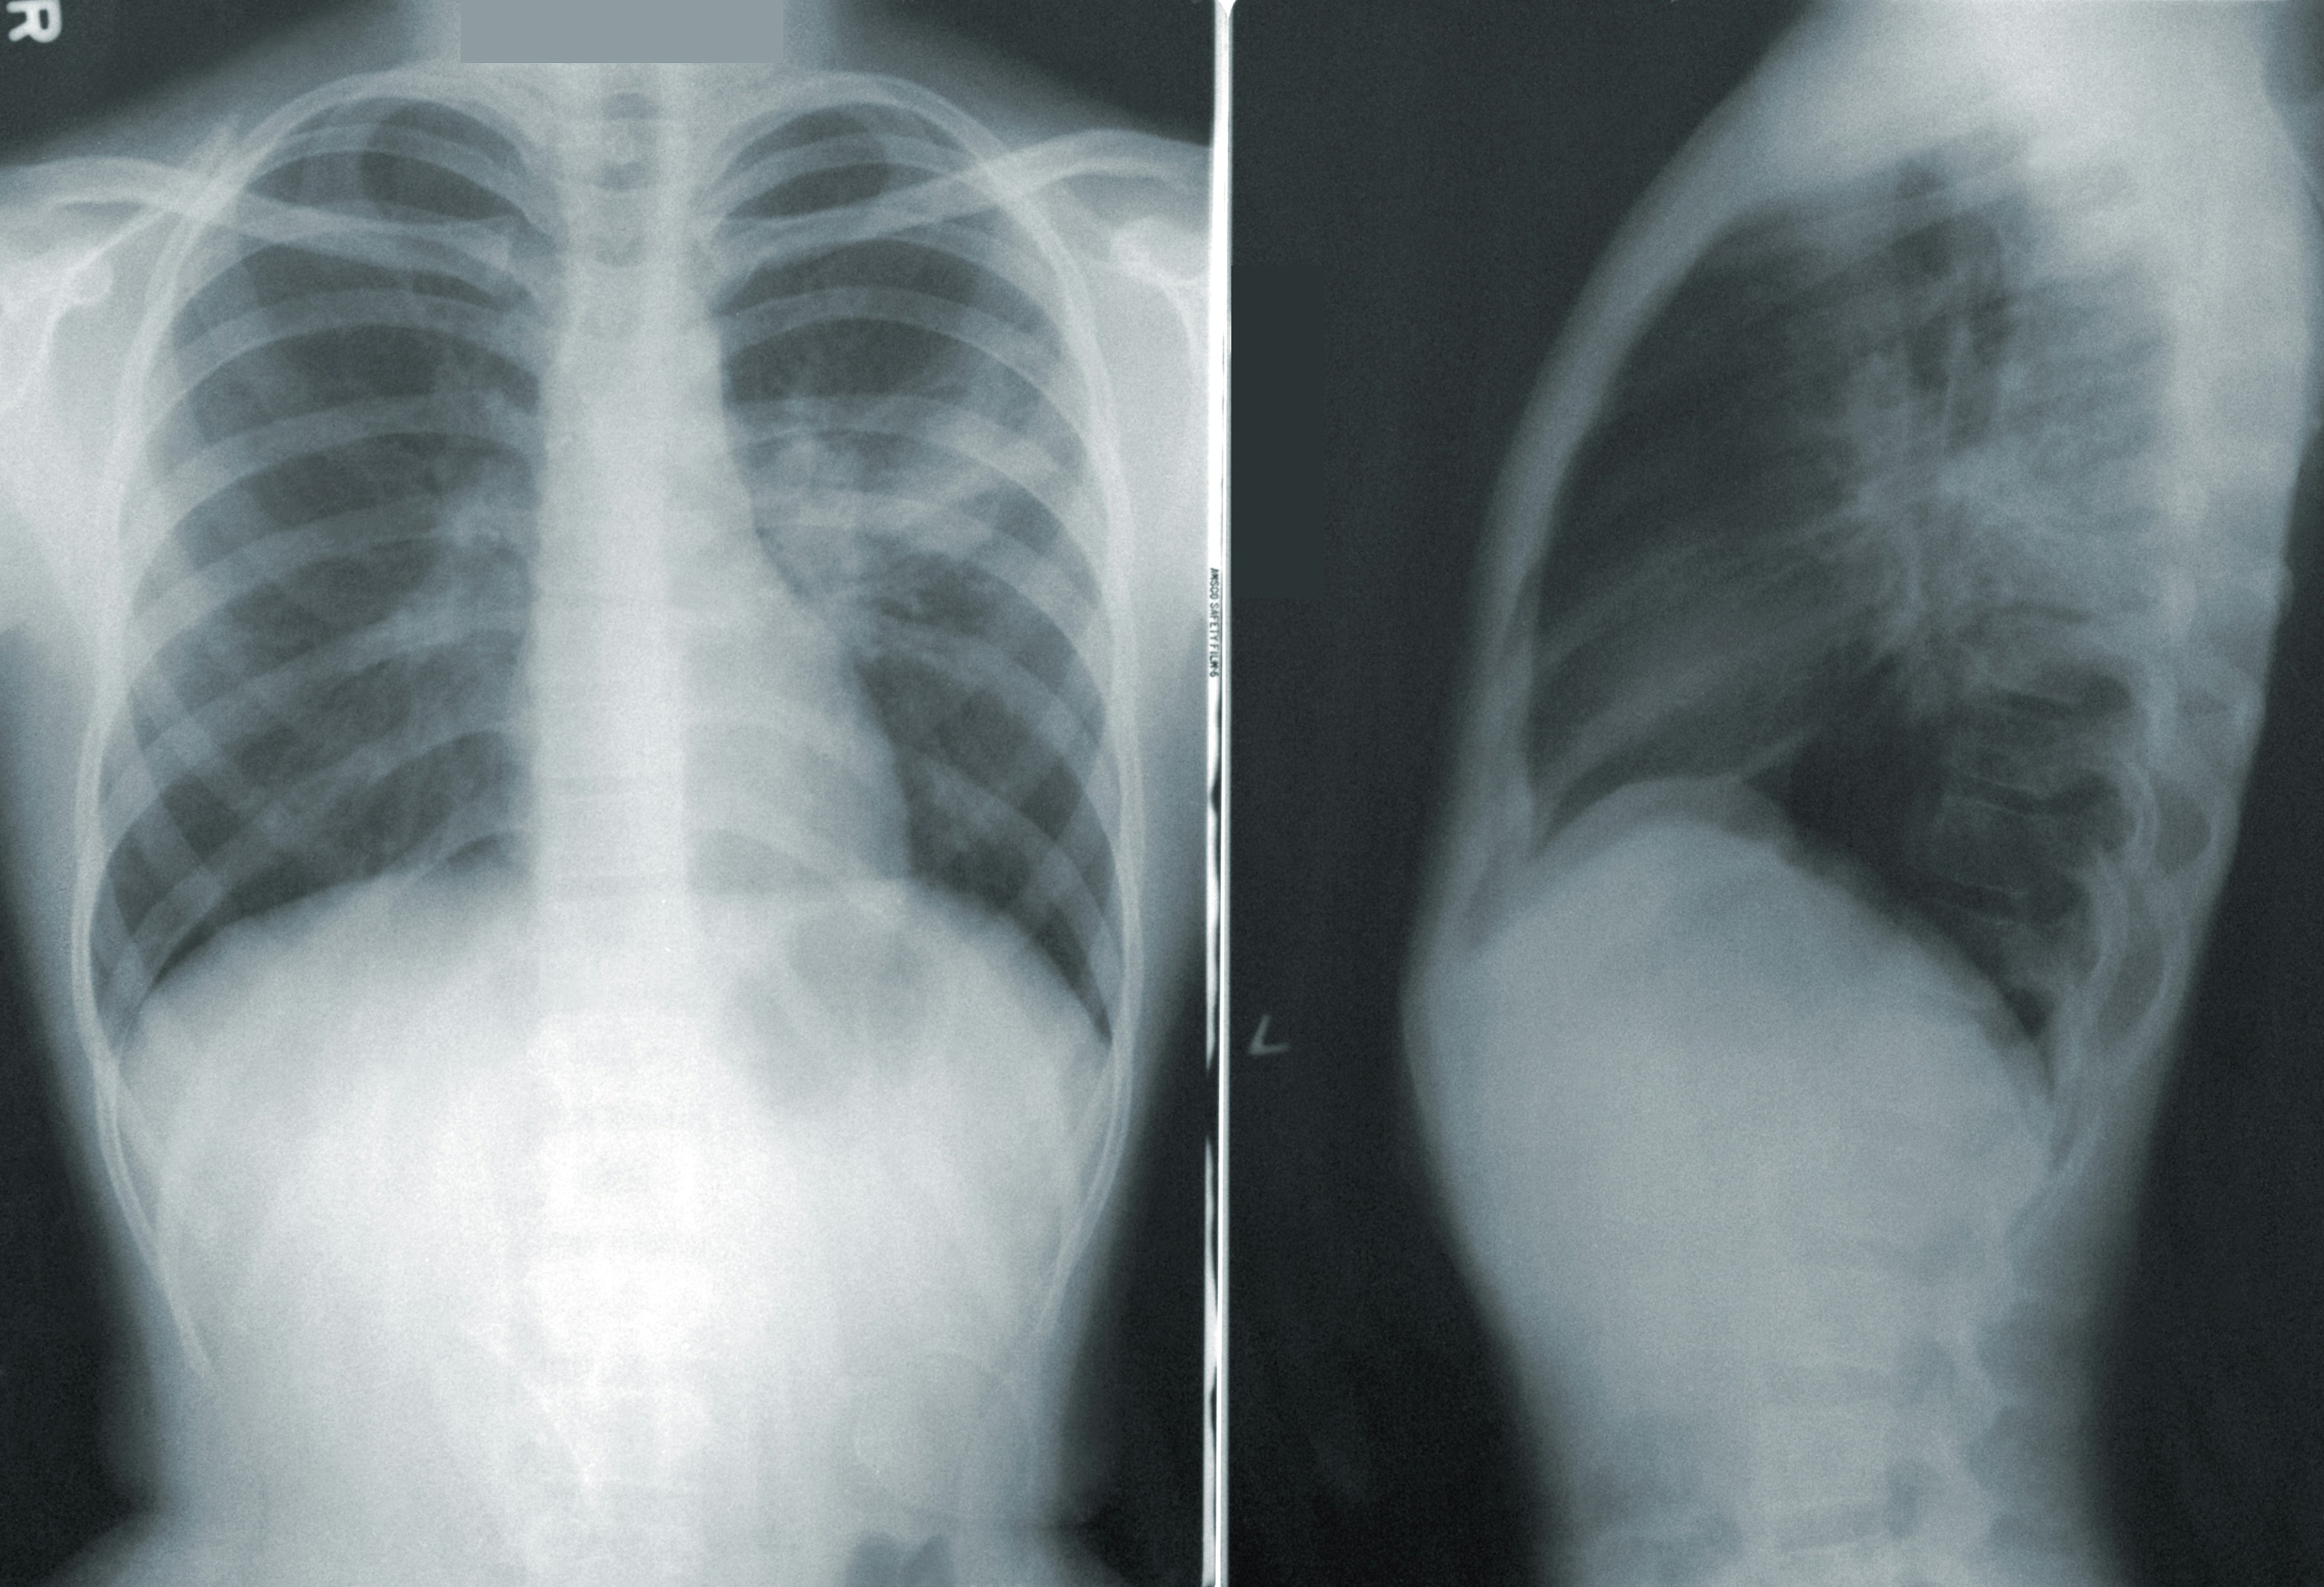
Coronary Calcium Score Prediction
This project aimed to develop a Machine Learning model using Convolutional Neural Networks (CNNs) to classify chest radiography images and predict the Agatston coronary calcium score. The internally developed model achieved a 32% cost reduction and reached a ROC-AUC of 0.75 using the VGG-19 architecture, demonstrating its ability to distinguish patients with different levels of coronary calcification—an important indicator of cardiovascular risk.
Tools used:
- Python, TensorFlow, Scikit-learn, VGG-19, Pandas, NumPy, and Seaborn.
- Jupyter Notebooks.
- Google Cloud Storage and Google Compute Engine.
- GitLab.

Statistical Study of Reference Intervals for Testosterone Tests Using Mass Spectrometry
This project focused on establishing reference intervals for testosterone tests using mass spectrometry, implemented in R. Accurate reference intervals are critical for correct clinical interpretation. The resulting reference values improved diagnostic accuracy and supported more informed clinical decision-making.
Tools used:
- R, RStudio, Tidyverse, dplyr, ggplot2, rlang, and rstatix.
- Normality tests, confidence intervals, and outlier detection.
- Shapiro-Wilk, Mann-Whitney, Dunn, magnitude tests, and bootstrap.
- Univariate, bivariate, and multivariate analysis.
- GitLab.

Generative AI in the Spine Orthopedics Patient Journey
Application of Generative AI to unstructured MRI and CT scan reports to build a patient journey dashboard for spine orthopedics within Digital Health. The solution enabled strategic decision-making for Primary Care and Digital Emergency services, resulting in R$3.9 million in additional revenue through optimized resource allocation and an 11% improvement in patient retention.
Tools used:
- Python, Vertex AI, Gemini API, Scikit-learn, Pandas, NumPy, Multiprocessing, JSON, and Seaborn.
- Google Colab and Google Cloud Platform.
- Prompt Engineering.
- Looker Studio.
- GitLab.
- Airflow.
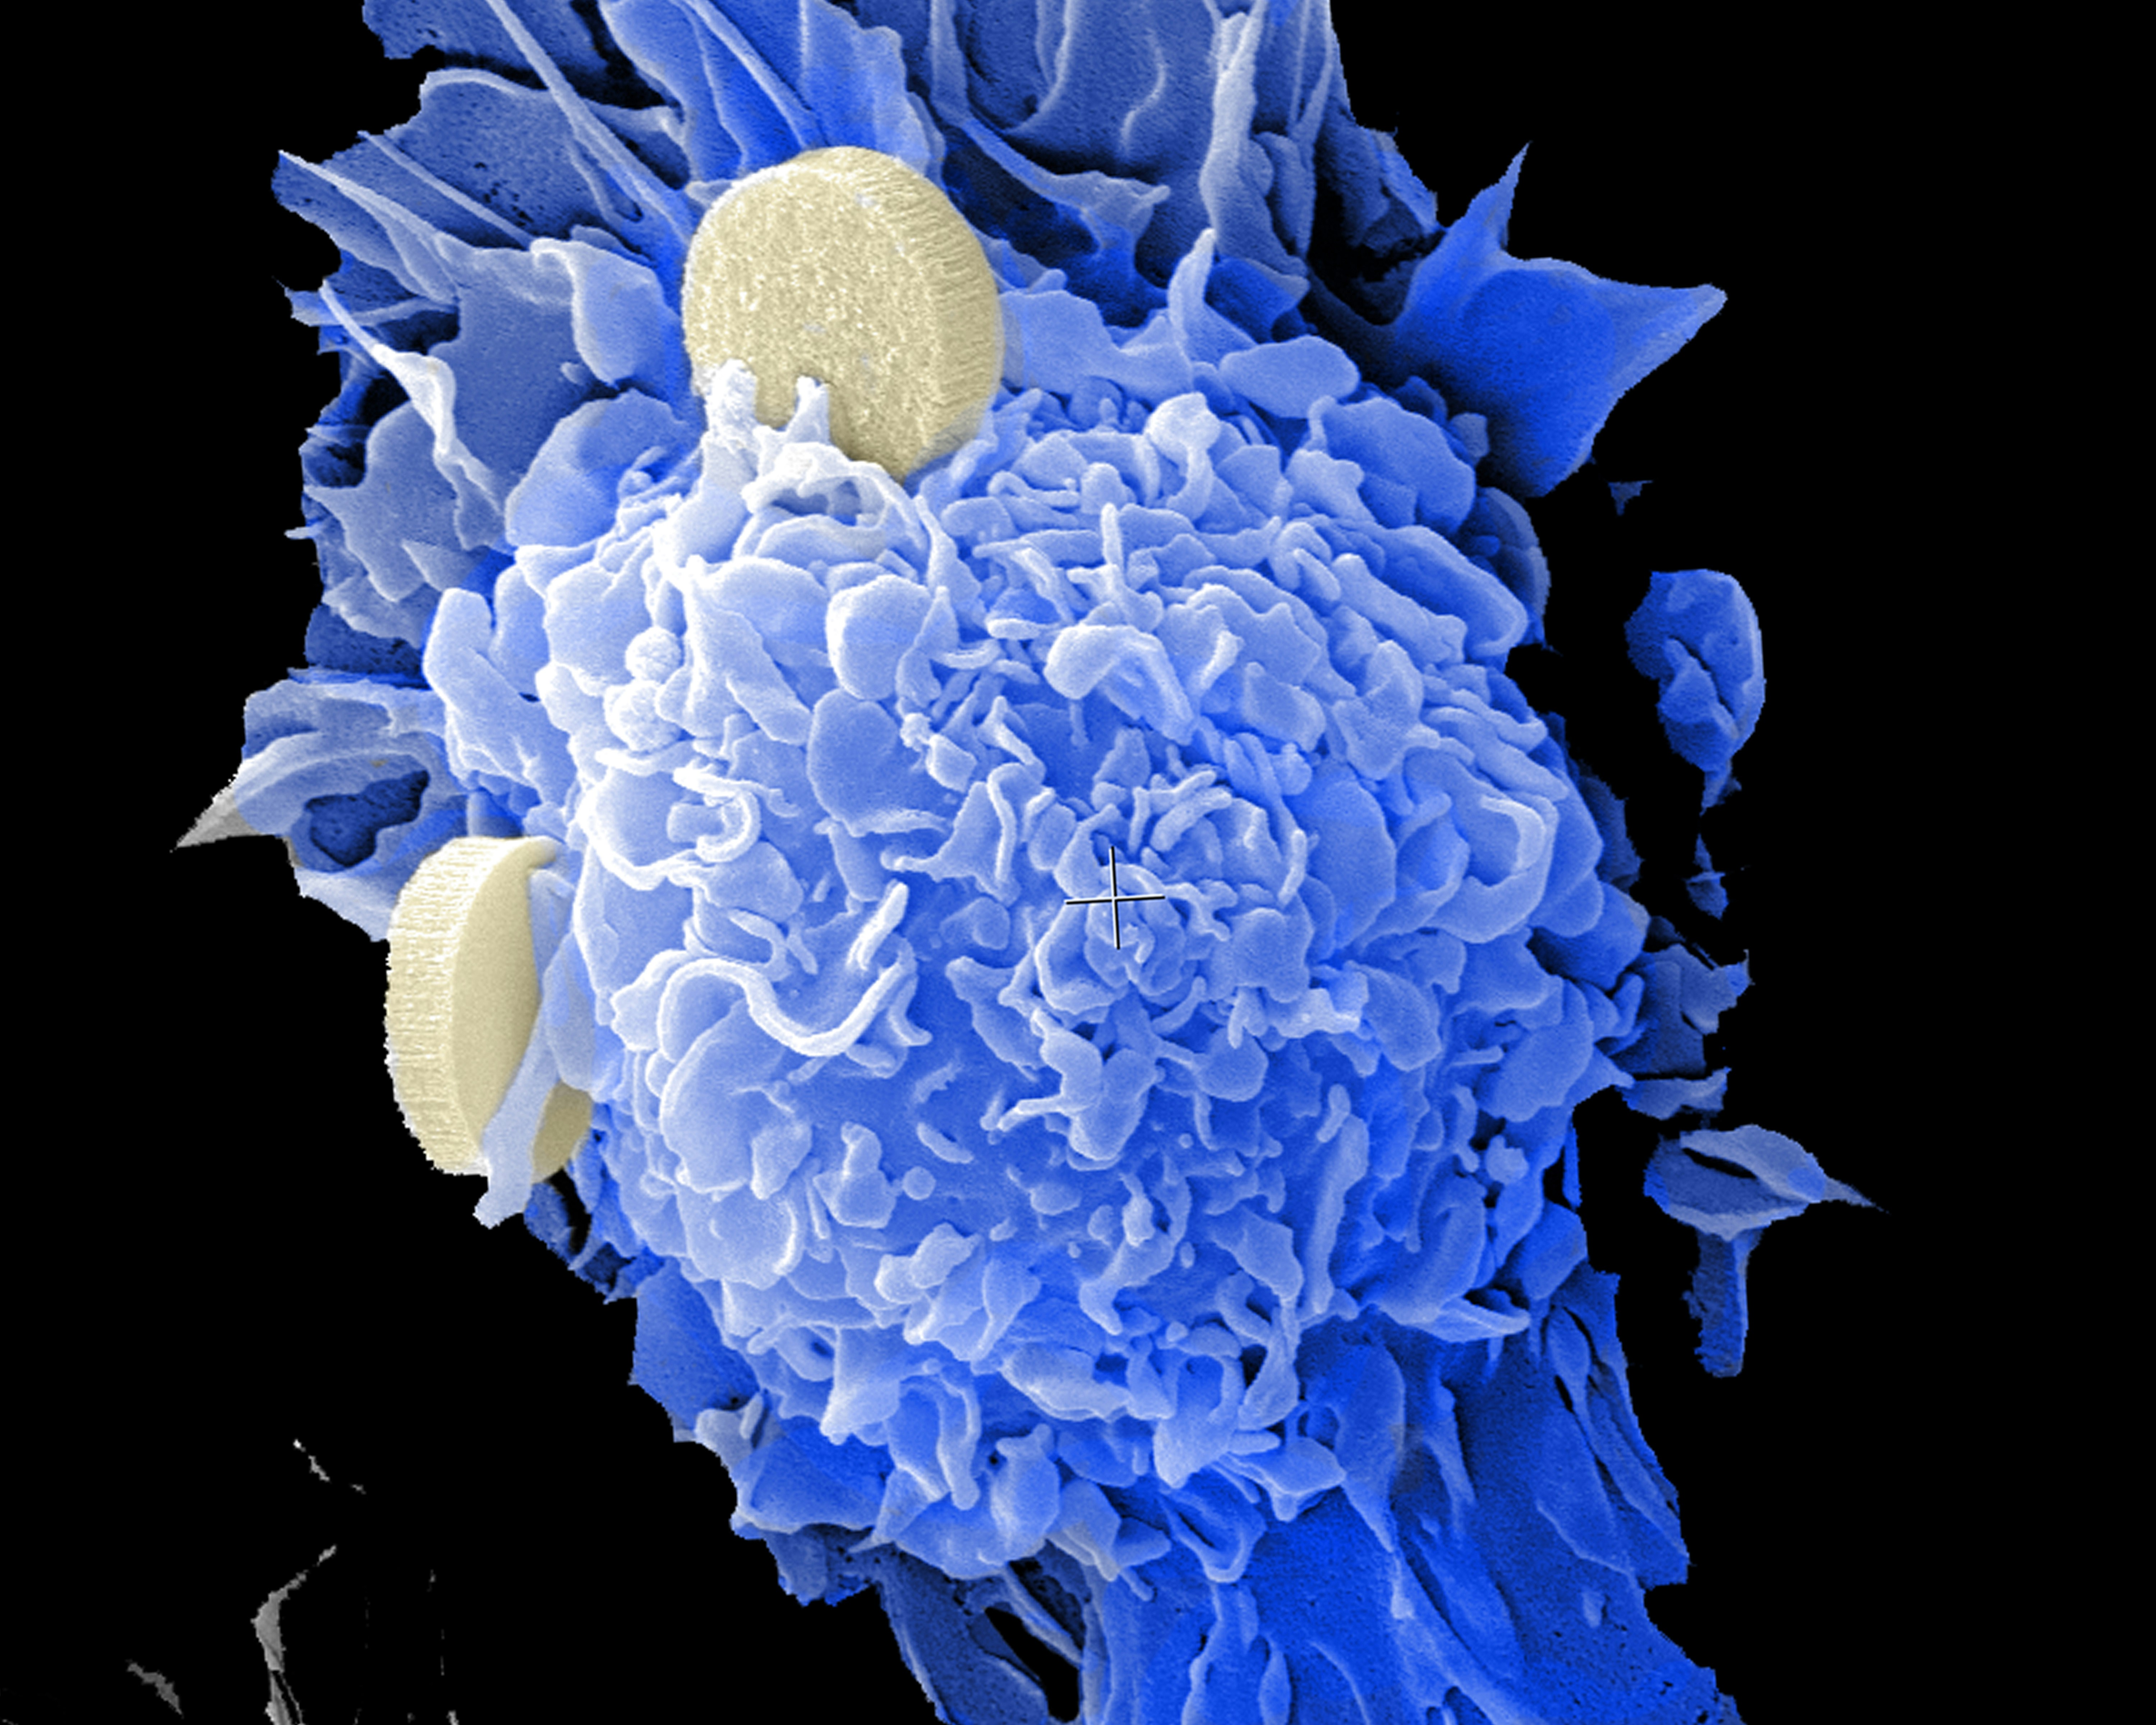
Generative AI in the Colorectal Cancer Patient Journey
Use of Generative AI on unstructured MRI, CT, and colonoscopy reports to identify patients undergoing colonoscopy and biopsy, extract critical information for colorectal cancer detection, and identify gaps in care. The solution supported oncology screening, population health management, and cost reduction for health insurance providers.
Tools used:
- Python, Vertex AI, Gemini API, Scikit-learn, Pandas, NumPy, Multiprocessing, JSON, and Seaborn.
- Google Colab and Google Cloud Platform.
- Prompt Engineering.
- Databricks.
- Looker Studio.
- GitLab.
- Airflow.